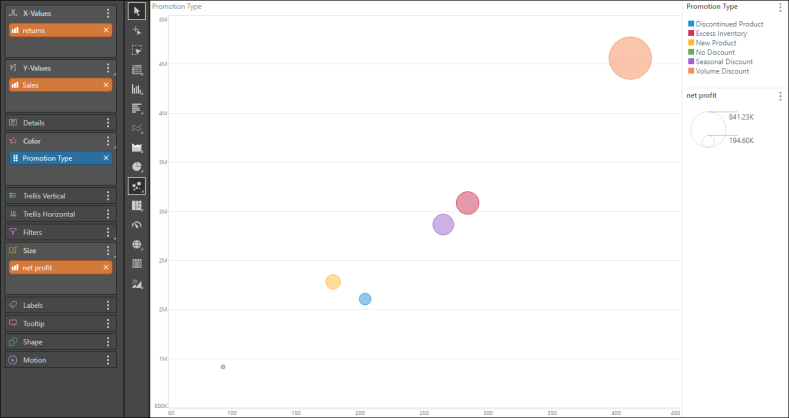
Use plotted charts to plot multiple measures in relation to a single member hierarchy, in order to determine a positive or negative correlation between the measures in relation to the hierarchy. Plotted charts require a measure in the X-Values drop zone, a second measure in Y-Values, and a member hierarchy on Color. A third measure may be added to Size.
Pyramid offers two types of plotted charts:
Each of these charts can be used to build a combo chart.